Interactive tools
Each of these started as an experiment written up on this site, and then got rebuilt as something you can actually operate. They run entirely in your browser — nothing is uploaded and there is no account.
START WITH AN EXPERIMENT
Change a setting. See what happens.
Free, no sign-up, and everything runs in your browser.
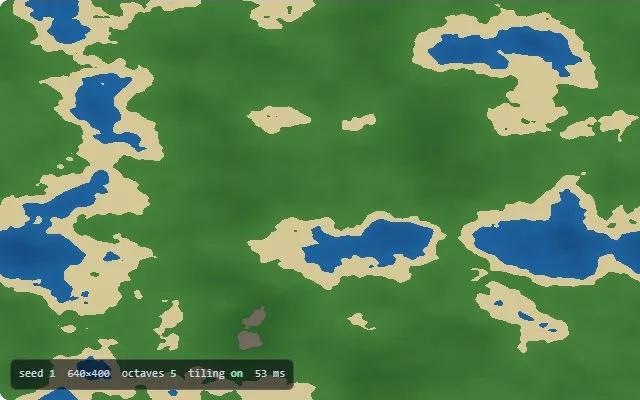
Build a landscape from noise.
Shape a seamless texture and save your own PNG.
Try it now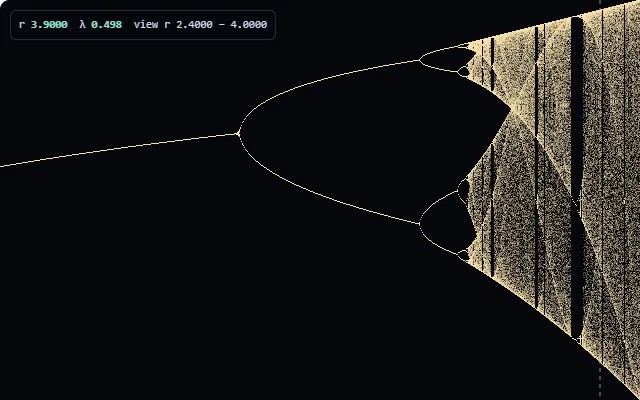
Watch order turn into chaos.
Zoom into the period-doubling cascade and find islands of order.
Try it now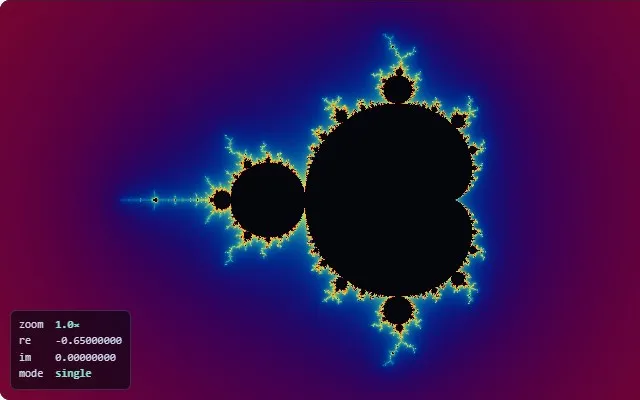
Zoom into another world.
Explore the Mandelbrot boundary and its hidden patterns.
Try it nowAll interactive tools
Mandelbrot Set Explorer
Drag and scroll to a view width of about 10⁻⁷, the measured limit on our tested GPU. Includes the matching Julia set, four preset landmarks, and shareable view links.
WebGL2 · emulated double precisionGame of Life Simulator
Conway’s Life with an editable rule string, so the same grid also runs HighLife, Seeds and Day & Night. Drop in a Gosper glider gun, or fill at random and watch the density trace fall into its equilibrium band.
Cellular automata · pattern libraryMonty Hall Simulator
Play by hand, then run a million trials. Change the number of doors — and, more importantly, change whether the host knows where the car is. That one switch is what turns 2/3 into 1/2.
Probability · up to 10⁶ trialsCentral Limit Theorem Simulator
Eight populations, any sample size from 1 to 1000, and the distance to the normal curve measured instead of eyeballed. See why “n = 30 is enough” holds for the uniform and fails badly for skewed, rare-event and Cauchy data.
Statistics · KS distance, 3σ tailsGradient Descent Visualizer
SGD, Momentum, Nesterov, AdaGrad, RMSProp and Adam descending the same surface at the same time, on Rosenbrock, Beale, Himmelblau, Rastrigin, a saddle and a ravine. Click to move the start point.
Optimization · six methods at onceMaze Generator
Eight algorithms — recursive backtracker, Prim, Kruskal, Wilson, Aldous–Broder, hunt-and-kill, binary tree, sidewinder — carving one wall at a time, scored side by side on dead ends and path length. Exports SVG.
Algorithms · SVG for plottersHilbert Curve Generator
Orders 1 to 9, coloured along the path, exported as a single continuous SVG polyline. Compares Hilbert against Z-order, row-major and boustrophedon on locality — where the usual claim turns out to be only half true.
Space-filling curves · SVGSierpinski Triangle Generator
Build the triangle by the chaos game or by recursion, switch to the carpet, the Vicsek cross or a polygon of your own, and read the box-counting dimension live — or upload an image and measure that instead.
Fractals · live box-counting dimensionK-Means Clustering Visualization
Step through assignment and update one click at a time, then run hundreds of restarts to measure how often random initialisation lands in a bad local optimum — and how much k-means++ fixes it.
Machine learning · restart histogramIsing Model Simulation
Metropolis dynamics on a lattice up to 256×256. Drag the temperature through the critical point at 2.269, compare the magnetisation against Onsager’s exact solution, and watch critical slowing down happen.
Statistical physics · exact referencePerlin Noise Generator
Fractal gradient noise with octaves, persistence and lacunarity, a seed you can keep, and seamless tiling that the 2×2 preview lets you verify. Exports a PNG up to 2048 pixels.
Procedural · seamless, seededN-Body Simulation
Gravity for up to 2,000 bodies with every pair computed exactly. Load the figure-eight orbit, the Pythagorean three-body problem, or collide two galaxies — and watch the energy drift to see how much to trust it.
Physics · exact pairwise forcesQuicksort Visualization
Pick the pivot as the first, last, middle, median-of-three or random element, choose Lomuto or Hoare, paste your own array, and step through every comparison with a full trace table.
Algorithms · step-by-step traceNash Equilibrium Calculator
Type a payoff matrix up to 4×4 and get every pure equilibrium, the iterated elimination of dominated strategies, and the mixed equilibria by support enumeration — with the indifference equations printed.
Game theory · pure and mixedDouble Pendulum Simulator
The exact equations under RK4. Run a dozen copies that differ in the ninth decimal place and watch the separation grow exponentially on a log plot, with the energy drift shown so you can check the integrator.
Chaos · RK4, energy trackedLogistic Map Bifurcation Diagram
Drag to zoom into the period-doubling cascade and the period-3 window, with the Lyapunov exponent drawn underneath so you can see which parts are really chaotic. Measures Feigenbaum’s constant from the superstable points.
Chaos · Lyapunov exponent, zoomableBirthday Paradox Calculator
Exact probabilities with the algebra shown, for any group size and any number of days. Set the days to a hash size and it answers birthday-attack questions instead.
Probability · exact, any scaleVoronoi Diagram Generator
Click points, drag them, export a PNG. Euclidean, Manhattan, Chebyshev and Minkowski distance, plus Lloyd relaxation with a live readout of how even the cells have become.
Geometry · GPU, up to 400 pointsPCA Visualization & Calculator
Paste a CSV or start with Iris: correlation matrix, eigenvalues, scree plot, 2D and 3D scores and a biplot, with every step shown. The trap dataset shows a component holding 89% of the variance that cannot tell two classes apart, and a 2% one that can.
Statistics · step-by-step, CSV exportLorenz Attractor Simulator
RK4 in 3D with up to 2,000 trajectories. Start two runs 10⁻⁹ apart, watch them part at t ≈ 24, and read the Lyapunov exponent as it settles near 0.906. Saves PNG and SVG.
Chaos · Lyapunov exponent, PNG/SVGHistogram Bin Width Calculator
Paste your data and get the bin width and bin count from Sturges, Scott, Freedman–Diaconis, Doane and three more rules, with the working shown, the bins to paste into Excel, and a KDE overlay that shows when two peaks merge into one.
Statistics · 7 rules, Excel binsPenrose Tiling Generator
Kites and darts or thick and thin rhombs, grown by Robinson-triangle subdivision. Show the matching-rule arcs, pick colours, and export SVG in millimetres with shared edges merged for laser cutting, or a PNG up to 6000 px.
Aperiodic tiling · SVG in mmTesseract 4D Rotation Visualizer
Spin a tesseract in all six planes of 4D space with the live 4×4 rotation matrix beside it. Switch between perspective and orthographic projection, try double and isoclinic rotations, unfold the net, and record a WebM.
4D geometry · live rotation matrixReaction Diffusion Simulator
The Gray–Scott model on your GPU. Click the F–k map to move between spots, stripes and dividing cells, paint with a brush, set Du = Dv to watch the pattern die out, and save a seamless PNG.
Turing patterns · WebGL2, seamless PNGActivation Function Visualizer
Sixteen activation functions and their derivatives on one graph — sigmoid, tanh, ReLU, GELU, Swish, Mish and more — plus a real backward pass that shows the sigmoid gradient vanishing as the network gets deeper.
Deep learning · 16 functions, backpropIterated Prisoner’s Dilemma Tournament
Fifteen strategies in a seeded round robin with noise and editable payoffs, a noise sweep, an evolution view, and a mode where you play against them yourself. Tit for Tat finishes fourth even with no noise.
Game theory · noise, exact scores
More are on the way — there are dozens more working demos behind the articles on this site, and they are being turned into standalone tools one at a time. The write-ups they came from are in Japanese; a selected few are translated in the English section, and the source code for the experiments is on GitHub.
Part of Shake AI Lab.