
18 min readUpdated
Tesseract Shadow: Interactive 4D Hypercube Projection
A tesseract is a four-dimensional hypercube with 16 vertices and 32 edges. Its familiar nested-cube picture is a projection: a 3D shadow of the 4D shape, projected again onto a 2D screen. Rotate the interactive model below to see why the inner and outer cubes appear to swap places.
A shadow carries less information than the object itself: a cube’s shadow can look like a square or a hexagon. Here I measure what a tesseract’s 4D→3D→2D projection loses in edge lengths, angles, and distances. The experiments compare perspective and orthographic projections, then test PCA, MDS, Isomap, and t-SNE against the original 4D geometry.
Explore a rotating tesseract’s 3D shadow
Press play and a 4D rotation in the xw-plane begins. The inner cube swells and trades places with the outer one — motion that a rigid 3D body can never produce. Why this looks like “stretching,” I’ll show with numbers later.
The full code for the experiment is on GitHub.
Building the tesseract in 4D coordinates
Construction is a plain extension of the cube. The vertices are all combinations of , giving of them. Two vertices form an edge when they differ in exactly one coordinate’s sign. The number of -dimensional faces is , and checking in code gives
- 16 vertices, 32 edges, 24 square faces, 8 cubic cells
exactly matching the “8-cell” name. The key property: in 4D all 32 edges have length 2, and the four edges meeting at each vertex are all mutually orthogonal (90°). It is a perfectly symmetric object, so if lengths or angles scatter after projection, we can say with certainty that it is entirely “a lie the projection added.”
4D→3D: the cleaner-looking perspective projection destroyed more distance structure
There are two broad kinds of projection. Orthographic (just drop the 4th coordinate w) and perspective (place the eye at on the w-axis and map into 3D with foreshortening; the scale factor is ). For each, I measured all 32 edge lengths and the angles around every vertex.
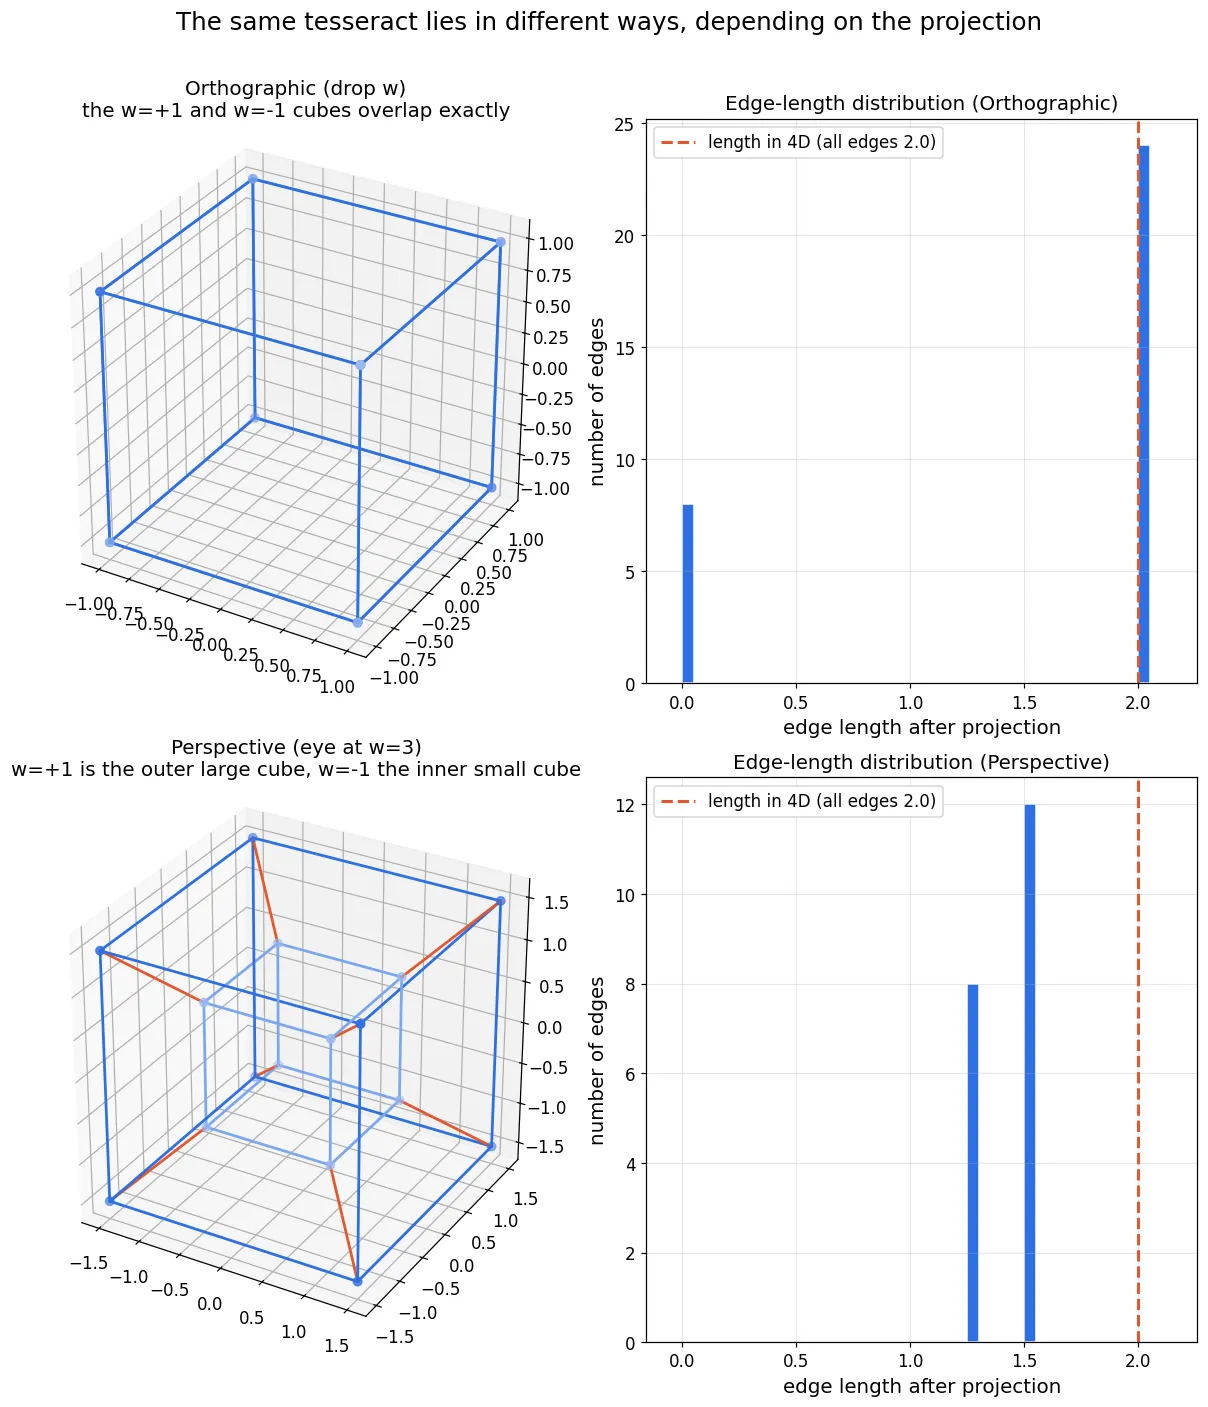
Orthographic was extreme. The 24 edges along x, y, z stay length 2, untouched, but the 8 edges along w collapse completely to length 0. Eight of the 16 vertices coincide in pairs, and the figure looks like a plain cube. Yet every surviving edge-to-edge angle stays exactly 90° — zero distortion.
Perspective looks far more capable at first glance. No vertices overlap; every edge is visible. But the edge lengths split into three classes. The outer cube’s edges are 3.0 (150% of the original), the inner cube’s are 1.5 (75%), and the 8 connecting edges are 1.299 (65%). That is a 2.31× spread between longest and shortest. The angles are worse: what was uniformly 90° in 4D now scatters across 54.7°–125.3°, an average deviation of 17.6° from 90°.
So which wins on the turf of preserving distance structure? Two rulers. stress-1 aggregates, over every pair of vertices, the discrepancy between “original distance” and “projected distance”; 0 means perfect preservation. By Kruskal’s own rule of thumb, 0.05 is good and above 0.2 is “poor.” Spearman correlation ignores the distance values themselves and asks how well the rank order of “which pairs are near and which are far” survives; 1 means that even if lengths are wrong, the near/far ordering is intact. I measured all 120 pairs of the 16 vertices with both.
| 4D→3D projection | stress-1 | Spearman of distances |
|---|---|---|
| Orthographic (8 edges vanish) | 0.217 | 0.830 |
| Perspective (all edges visible) | 0.250 | 0.654 |
Surprisingly, the orthographic projection — which utterly crushed 8 edges and 8 vertex pairs — preserved the overall distance structure better. Perspective, in order to “fit everyone on screen,” spreads a thin lie across every pair’s distance. Orthographic dumps all the sacrifice onto 8 pairs and leaves the rest pristine. The same pattern I saw when Isomap flattened a Möbius strip by pinching a single spot to balance the books was already present here, in a classical projection.
4D→2D: four DR methods, and the crushing defeat of the PCA that should have beaten them all
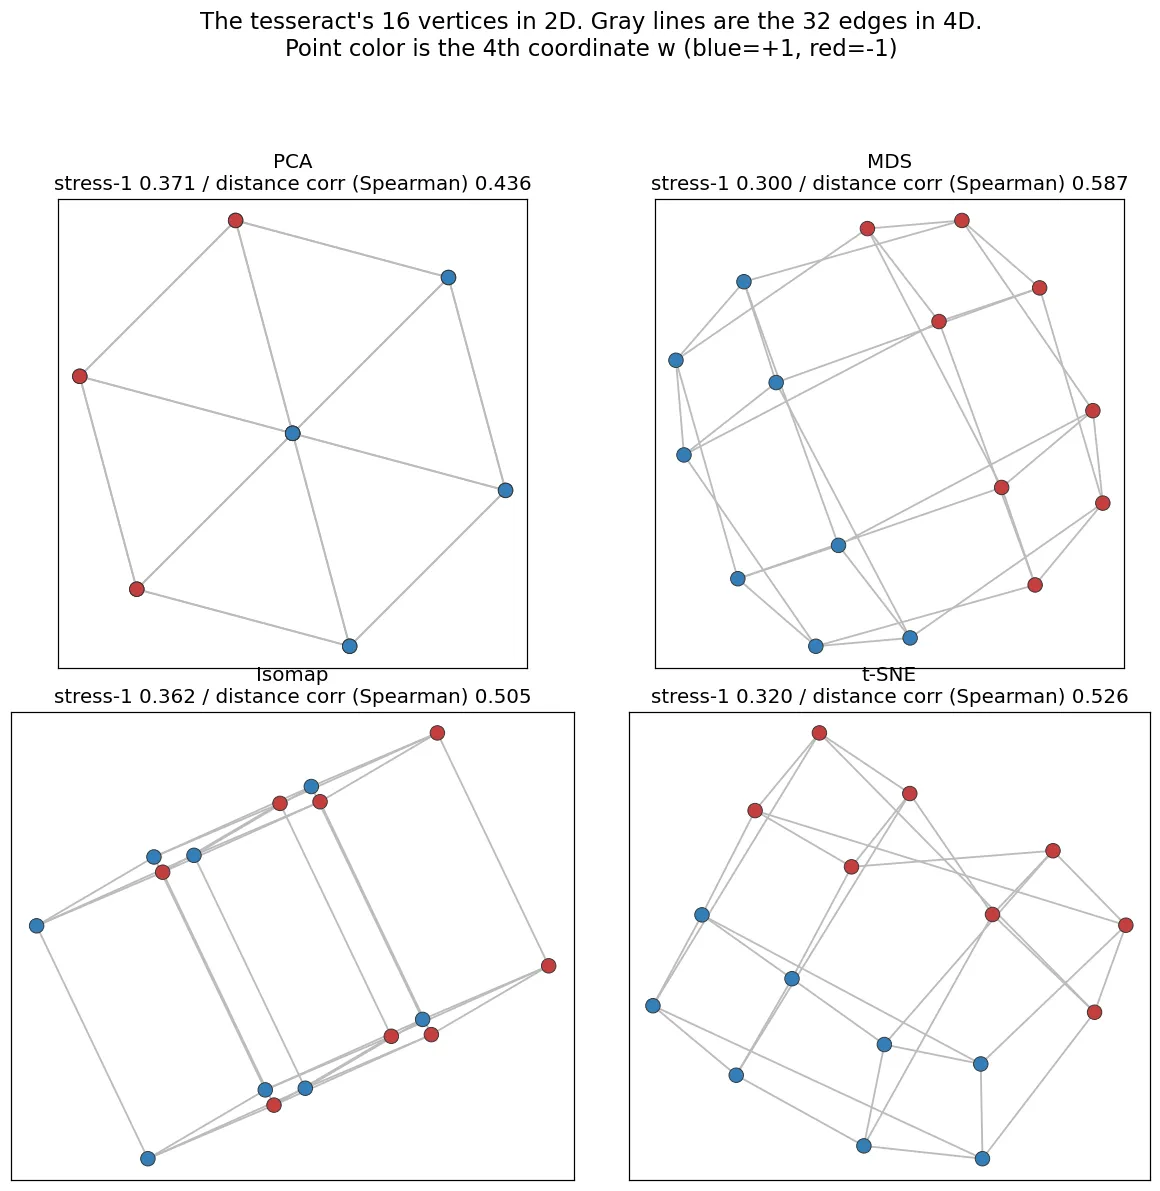
Next, the shadow of the shadow — 2D. I embed the 16-vertex set into 2D with PCA, MDS, Isomap, and t-SNE, and measure how much of the 4D distance structure survives. The tesseract’s pairwise distances take only four values, set by the number of differing coordinates (distance 2 for 32 pairs, for 48 pairs, for 32 pairs, and 4 for the 8 antipodal pairs).
| Method | stress-1 | Spearman | Distance-order inversion rate |
|---|---|---|---|
| PCA | 0.371 | 0.436 | 27.4% |
| MDS | 0.300 | 0.587 | 21.8% |
| Isomap (k=4) | 0.362 | 0.505 | 27.2% |
| t-SNE (perp=5) | 0.320 | 0.526 | 24.5% |
MDS is best, yet even it leaves a 21.8% order inversion — “a pair that is far in 4D ends up nearer in 2D.” Roughly one pair in five has its near/far swapped while we gaze at “that tesseract picture.”
Now look at PCA, top left. There should be 16 vertices, but only 7 are visible. Twelve pairs of vertices coincide exactly. The cause: the eigenvalues of the tesseract’s covariance are all identical at 1.0667. Every direction has the same variance, so the maximum-variance subspace is not unique. The two axes returned by this implementation are optimal for PCA, but PCA does not minimize pairwise-distance stress.
To see how arbitrary, I drew 200 random orthogonal projections 4D→2D and measured their stress: 0.312–0.368 (mean 0.334). PCA’s 0.371 … lost to all 200. “Just use PCA” can be worse than a blind guess on perfectly symmetric data. The maximize-variance criterion only means something once there is a difference in variance — obvious once written down, but I had not expected PCA to land on the worst side.
How degradation grows with dimension: cube → tesseract → 9D hypercube
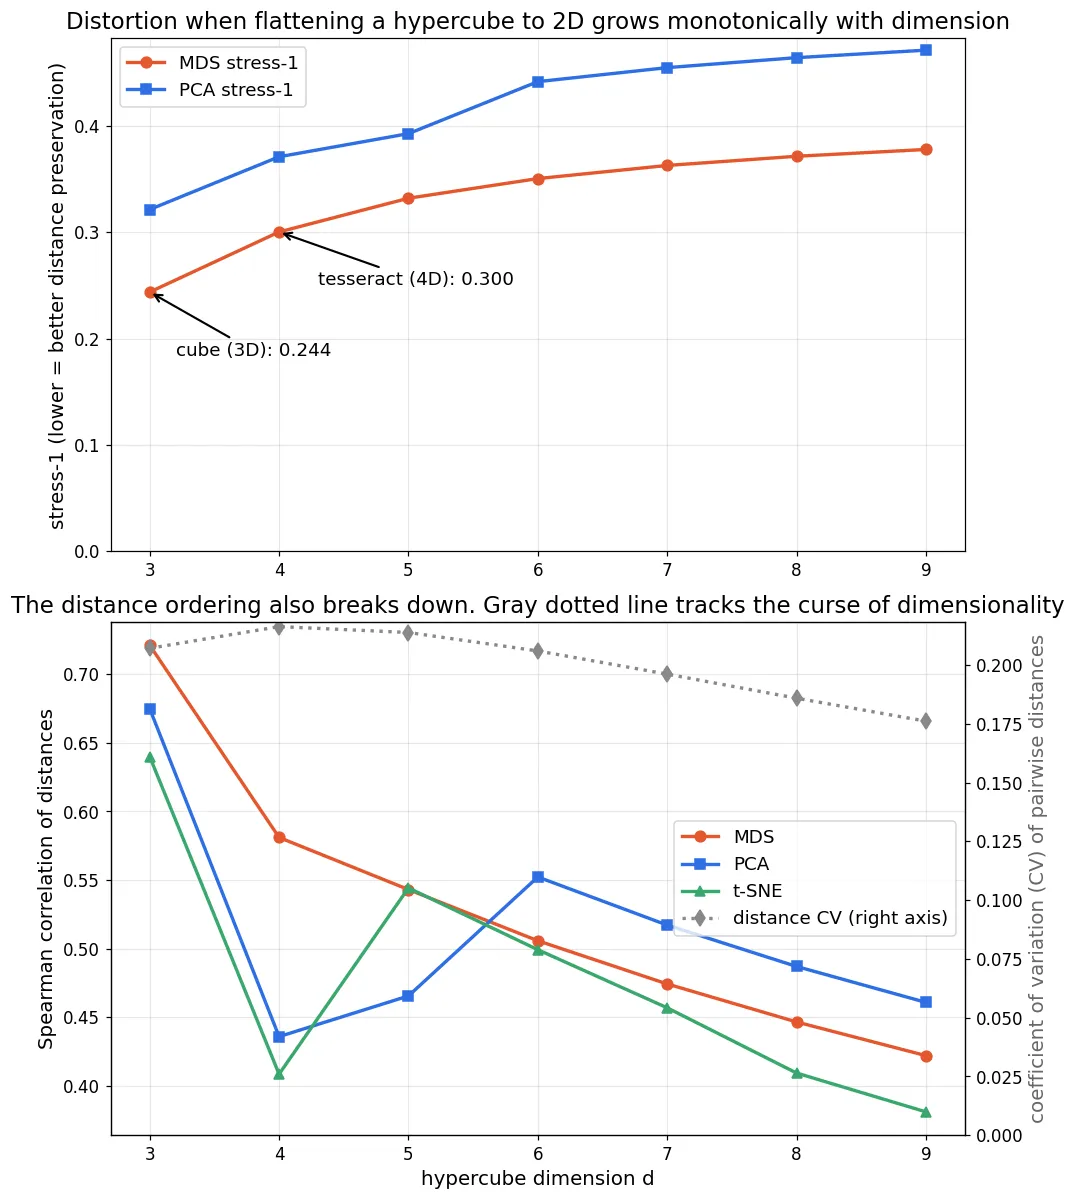
So is 4D “still OK”? Raising the dimension from the cube (3D, 8 vertices) to the 9D hypercube (512 vertices), I measured the degradation of the 2D embedding.
| Dimension | Vertices | MDS stress-1 | MDS Spearman | CV of distances |
|---|---|---|---|---|
| 3 (cube) | 8 | 0.244 | 0.721 | 0.207 |
| 4 (tesseract) | 16 | 0.300 | 0.581 | 0.216 |
| 5 | 32 | 0.332 | 0.543 | 0.214 |
| 6 | 64 | 0.350 | 0.506 | 0.206 |
| 7 | 128 | 0.363 | 0.474 | 0.196 |
| 8 | 256 | 0.371 | 0.447 | 0.186 |
| 9 | 512 | 0.378 | 0.422 | 0.176 |
Three things happened that I did not predict.
First: degradation is monotonic but does not explode. Stress keeps rising 0.244→0.378, but the increments keep shrinking. The per-dimension worsening is largest at 3D→4D (+0.056) and only +0.006 at 8D→9D. The biggest collapse happens the moment you step out by a single dimension.
Second: the gray dotted line, the coefficient of variation (CV) of pairwise distances (their spread divided by the mean; larger means a sharper distinction between near and far pairs), falls with dimension (0.216→0.176). This is exactly the “distances get evened out in high dimensions” phenomenon from the curse of dimensionality. Pairwise distance is with binomially distributed, so the relative spread shrinks as . In a high-dimensional hypercube, the individuality of the very distances you are trying to preserve fades away. Stress growth slows, ironically, partly “because there is less left to protect.”
Third: the Spearman correlation of PCA and t-SNE did not fall monotonically — it bottomed at d=4 (0.436, 0.409) and recovered a bit at d=5–6, a zigzag. PCA’s d=4 in particular sticks out as worse than its neighbors. The “luck-of-the-draw axis selection” from the fully degenerate eigenvalues in the previous section happened to land on the worst side exactly at d=4. I had expected a smooth degradation curve, so this surprised me.
For the record, these 16 vertices are not a curved manifold like a Swiss roll but a discrete, perfectly symmetric point configuration. There is no “secretly low-dimensional” structure anywhere for manifold learning to exploit — it is essentially incompressible data — which is exactly why the limits of dimensionality reduction show up so cleanly in the numbers.
Six kinds of 4D rotation: only the three involving w look like stretching
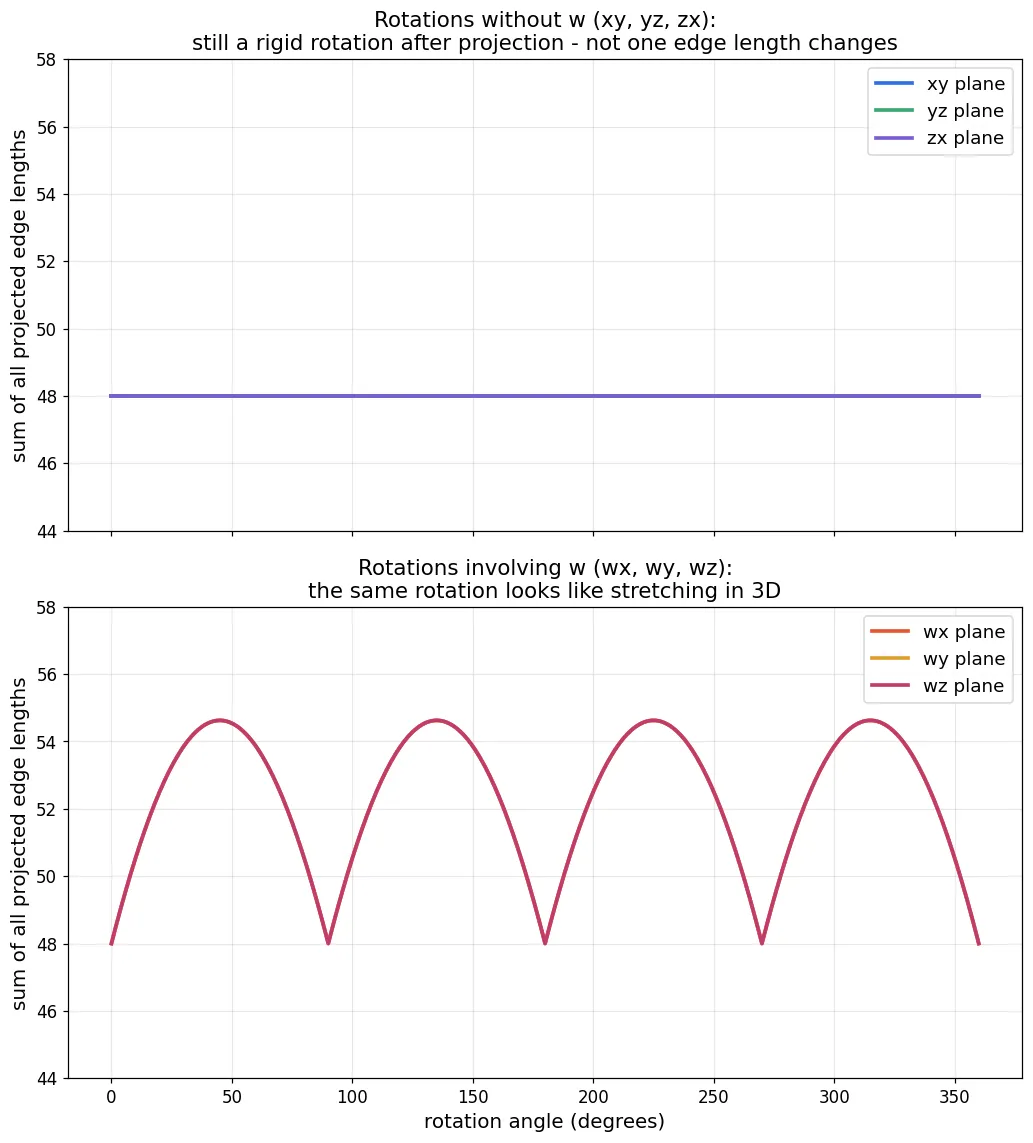
Finally, the reveal for the opening animation. A 3D rotation has three independent planes (xy, yz, zx), but 4D has : xy, yz, zx, wx, wy, wz. Rotating in each plane from 0° to 360°, I tracked the 32 edge lengths after orthographic projection into 3D.
| Rotation plane | Per-edge length variation (max) | Range of total edge length |
|---|---|---|
| xy, yz, zx | 0.000 (perfectly invariant) | 48.000 (constant) |
| wx, wy, wz | 2.000 (oscillates 0⇔2) | 48.000–54.627 |
The result split cleanly in two. In the three rotations that do not involve w, not a single one of the 32 projected edge lengths changes — not to four decimal places. Projection (dropping w) and rotation (mixing only x, y, z) do not interfere, so the shadow simply rotates as a rigid 3D body.
In the three rotations that involve w, edges stretch and shrink between length 0 and 2. For a wx rotation, the projected length of an x-edge oscillates as and a w-edge as (at the 45° instant, 16 of the 32 edges are exactly ). The fourth coordinate does not appear in the shadow, so any edge that “turns toward it” can only shrink and vanish in the shadow. The reason the inner cube swells and swaps with the outer one in the opening animation is that, as each cube’s w-coordinate flips sign, the perspective scale factor () swaps between them.
So the famous line “a 4D rotation looks like a deformation in 3D” is, precisely, a property of only half of the six degrees of freedom — and exactly which edge shrinks by how much at which angle is fully described by simple trigonometry. Put the other way: if a rigid body in front of you appears to stretch on its own, that is evidence it is rotating in a plane that includes an invisible axis. Even seeing only the shadow, you can infer the higher-dimensional motion from the way it distorts.
What surprised me from doing this by hand
The biggest surprise was PCA. Losing 0-for-200 against random projections broke an unconscious trust that “PCA is at least better than random.” It is an extreme situation — perfectly symmetric data with degenerate eigenvalues — but just as when a trefoil knot or a Möbius strip poked at an algorithm’s assumptions, a tool slides silently into guesswork the moment its premise breaks. And if you do not measure stress, PCA’s picture is “a clean figure of 7 points” — it actually looks nicer.
The other was perspective losing to orthographic on distance preservation. The “good picture” where every vertex is visible quantitatively contained more lies. Legibility and fidelity are different quantities — and not even a trade-off; they simply point in different directions. Kill 8 spots completely and leave the rest untouched, or paint a thin lie over everything. Neither shadow is correct, but the distribution of the lie differs. When you summarize something into a single figure, it is worth being aware of which kind of lie you chose.
What this experiment cannot claim
- The method ranking is only about these 16 vertices. Sixteen points is extremely small as input to dimensionality reduction, and Isomap’s neighbor count 4 and t-SNE’s perplexity 5 strongly affect the result. “MDS is best” cannot be generalized beyond the hypercube.
- “PCA lost to random” does not mean PCA is bad. It is the result of a special case where all four eigenvalues are identical — where the maximum-variance subspace is not unique. On ordinary data with differing variances it works fine. The reported stress belongs to this particular output basis. Other equally optimal PCA bases can have different stress; maximizing retained variance and minimizing distance stress are different objectives.
- I did not measure the “legibility” side. I argued “legibility and fidelity are different” on the premise that perspective is more legible than orthographic, but I only quantified fidelity; legibility stayed subjective.
- The rotation analysis rotated the six planes one at a time. A general 4D rotation includes “double rotations” where two planes turn simultaneously, and I did not measure edge-length behavior there.
No shadow is correct. And yet the distortion does not lie
Every tesseract picture — orthographic, perspective, MDS — lies somewhere. As long as stress-1 is not 0, no one can avoid it. What this experiment revealed is that the placement of the lie has more individuality than its total amount. A shadow that crushes 8 pairs completely and protects all the rest, versus one that paints a thin lie over everyone. The same choice Isomap made when it concentrated its sacrifice at a single pinch on the Möbius strip was already there, inside a plain projection, long before dimensionality reduction was invented.
And the shadow also carries the trace of the dimension it discarded, as distortion. If the figure in front of you seems to stretch on its own, that is evidence it is turning in a plane that includes an invisible axis — and you can name which edge shrinks by how much and when, in trigonometry. 4D itself I will probably never see in my life. But the fingerprint that the invisible leaves on its shadow can be read, if you measure it. Every number I have counted in this article is one of those fingerprints.